


Medium-Term Management Plan 2024
The Group has formulated its Medium-Term Management Plan 2024 (for the FY2025/3 to FY2027/3), and is working to enhance corporate value under the management theme: “Try Harder – Toward a New Stage of Growth.” In addition to the growth of our core businesses, M&A promotion and cost structure reform are positioned as basic policies. As we conclude the first year of the plan, we would like to report on the Group’s initiatives and outlook going forward.
In the fiscal year ending March 2025, our core businesses—unsecured consumer loans, business loans, credit guarantees, and installment sales finance—have all performed in line with plan, giving us a strong sense of steady progress in our business strategy. M&A initiatives and cost structure reforms are also progressing smoothly, and we feel confident about achieving the goals set forth in our current plan.
In addition to our financial performance, we are also making steady progress in non-financial initiatives such as promoting digitalization, recruiting, and talent development. In today’s rapidly changing business environment—driven by technological innovation and evolving consumer behavior—digital transformation has become a key enabler of improved operational efficiency and enhanced customer service quality.
To achieve sustainable growth, flexibility and speed are essential. The Group will continue to strengthen its competitiveness by deepening its core businesses and generating future profit opportunities, while also embracing change and maintaining a spirit of continuous challenge.
Aiming to Become a Company that Lasts 100 Years
We have a long-term vision of “Aiming to Become a Company that Lasts 100 Years”, and to keep up the continuous growth, we are working on the following three growth strategies.
First, we aim to raise the overall profit level of the Group by securing a stable earnings base through loan balance growth in our core businesses, and by pursuing greater operational efficiency through economies of scale and IT-driven transformation.
Second, we will reinvest profits earned from our core businesses into M&A initiatives that drive future profit creation, including expansion of our customer base and the development of new business domains. Through this, we intend to enhance our competitiveness and capture emerging market opportunities.
Third, by internalizing system development, we are building a framework that enables rapid responses to customer needs. This approach allows us to improve UI/UX, increase customer satisfaction, and enhance operational efficiency, all of which contribute to delivering better services.Through these strategies, we are laying the foundation for realizing our long-term vision and pursuing sustainable growth. With a shared commitment across all employees, we will continue to take on new challenges as one team toward the future we aspire to create.
Lastly, I would like to express my sincere appreciation to our shareholders and investors, as well as to our dedicated employees and all stakeholders who are working hard to advance this plan. We look forward to your continued support.
General Manager
Operation Management Department
Ikumi Abe
For more details, please see Medium term Management Plan.
Theme of the Medium-term Management Plan

Fundamental Policies
Invest in M&A
Invest in M&A to bring changes to the Top-line portfolio composition
Total investment of 60.0 billion yen MAX
Cost Structure Reform
Implement Cost Structure Reform by reviewing human resource compositions and utilizing in-house engineers, etc.
Cost reduction of 5.0 billion yen or more over 3 years
Well-focused investments will be continued centered on the high performing 4 Core Businesses

Consumer finance

Small business loan

Credit guarantee

Installment sales
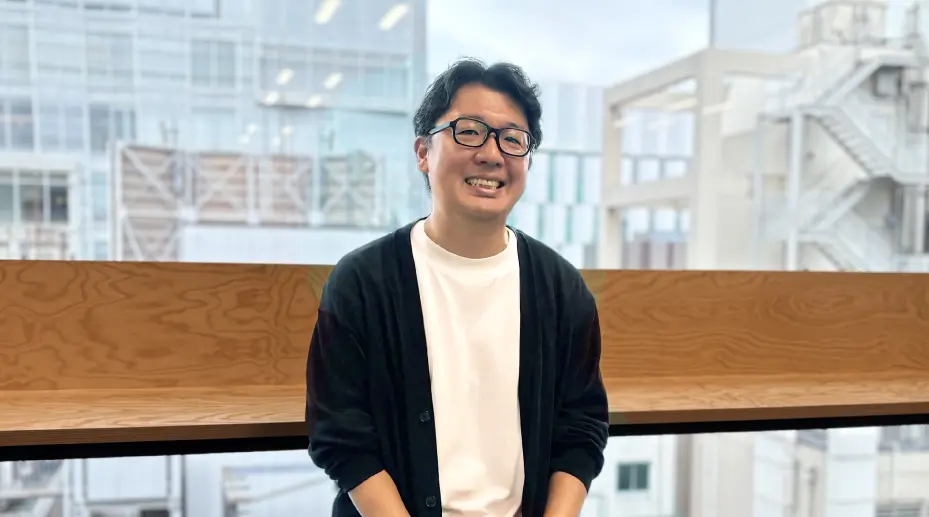
Financial Indicators
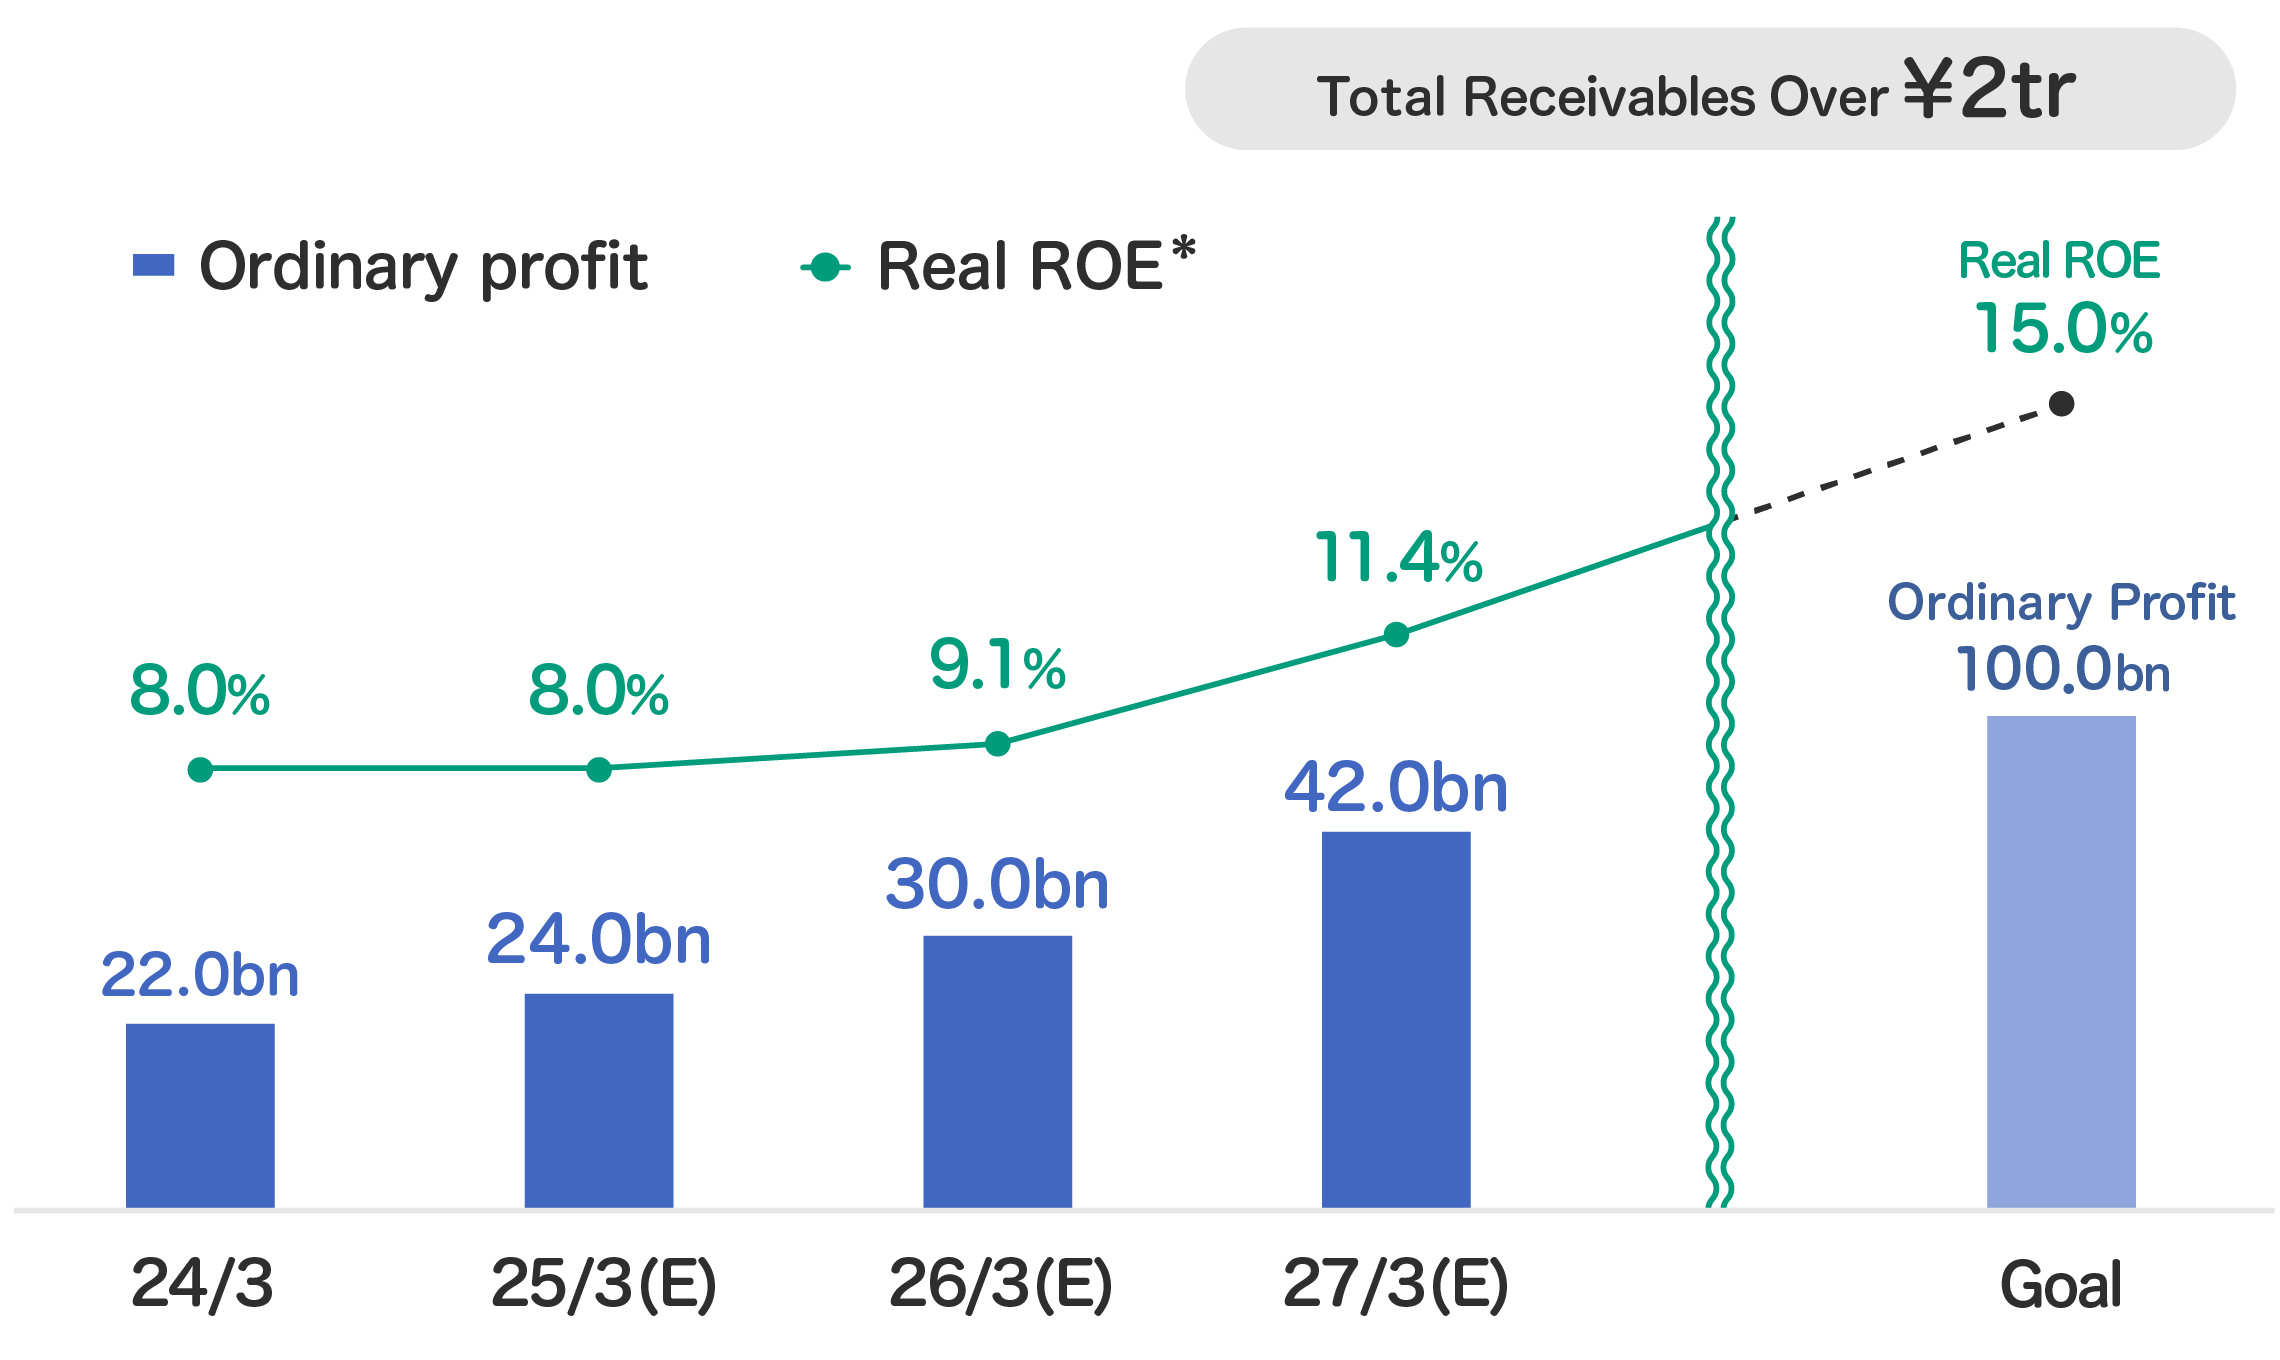
*Real ROE is calculated based on Profit attributable to owners of parent assuming an effective tax rate at 30%
| 24/3 | 25/3 | 26/3 | 27/3 | ||
|---|---|---|---|---|---|
| Result | Plan | Result | Plan | Plan | |
| Operating Revenue (billion yen) | 163.1 | 180.0 | 189.0 | 198.0 | 218.0 |
| Ordinary profit (billion yen) | 22.0 | 24.0 | 26.8 | 30.0 | 42.0 |
| ROA (%) | 1.9 | 1.8 | 2.0 | 2.0 | 2.5 |
| ROE (%) | 11.7 | 10.3 | 10.8 | 9.6 | 12.6 |
| Equity ratio (%) | 15.6 | 15.2 | 15.0 | 15.1 | 15.5 |
Capital Policy
Equity Ratio Indicator (Capital Policy )

Indicator
Equity Ratio of
15% or more

The equity ratio is an indicator that should be improved as a higher ratio increases security. However, at the current stage (Phase of growing balance), we aim to maintain an equity ratio of 15% or higher considering the risks to be covered by capital.
Risks Covered by Capital
Regarding risks, expected losses are covered by normal business operations, while unexpected losses* are covered by capital.
*The difference between the expected maximum loss amount and the average loss amount (expected loss)
Growth Investment and Shareholder Return(Capital Policy )
①Growth Investment(2025/3~2027/3)
Total investment of
¥600bn MAX
M&A
Capital Investment
- Group Synergy
- Potential for Future Group Growth
- Contribution to Consolidated ROE of 10% or More
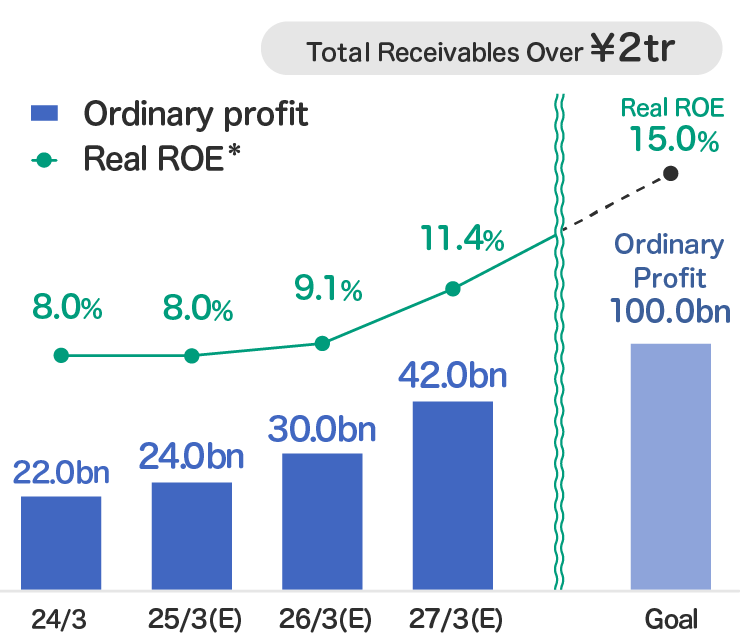
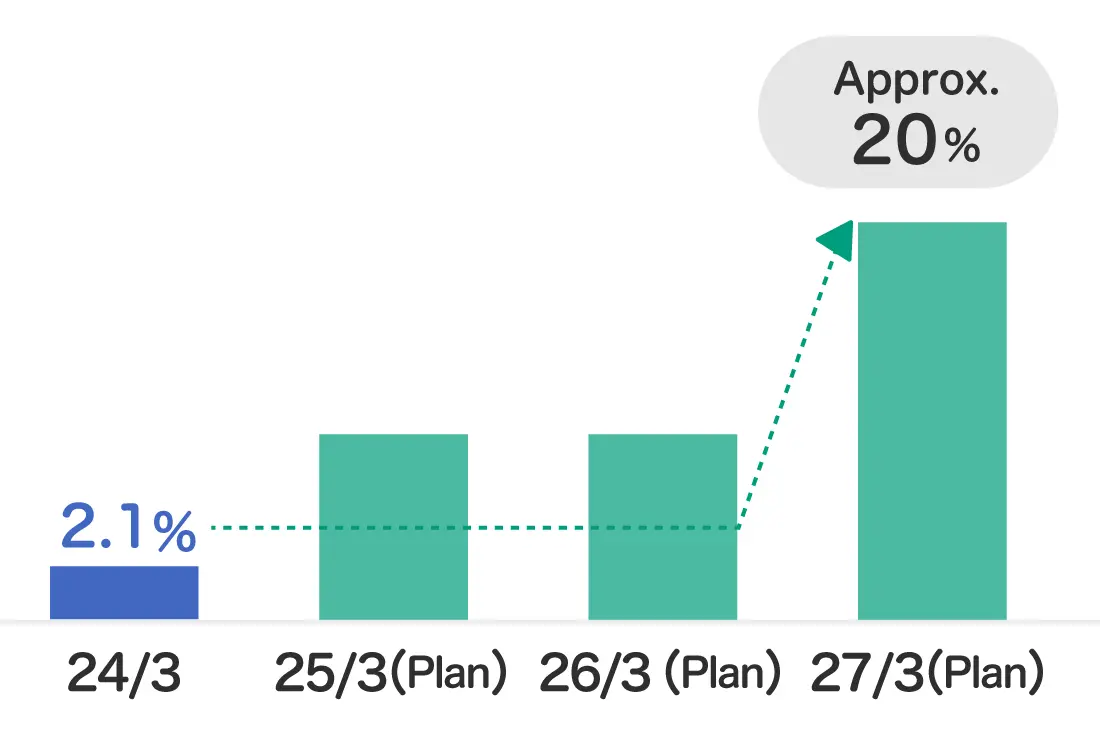
②Shareholder Return(2027/3)
Targeting a Total Payout
Ratio of around20%
Share buybacks
Dividend
While prioritizing growth investments, we aim to enhance shareholder returns targeting a total payout ratio of around 20% in the final year of the plan.
Considering share repurchase based on capital adequacy status